THE VERDICT · NOT SUPPORTED
Apps that edited their listings had not fallen further beforehand.
I thought apps that edited their listings would have dropped further in the charts beforehand. That is not what I found in this sample. The apps with edits did not fall more, on average, than the similar apps I compared them with.
This does not mean nobody ever edits after a decline. It means this study did not establish that pattern.
See what I found ↓
THE IDEA
Why did I test this?
I often see an app drop in the charts, followed by a new title or description. It is tempting to connect the dots: “They dropped, so they changed the listing.” But the app might also have launched a new version, started a promotion or changed its product.
So I asked myself: do apps that change their listing tend to fall further in the charts before that change than similar apps that do not?
I looked at how an app moved in the chart.
I checked whether its title or full description changed later.
I compared it with similar apps that had no observed edit.
A change after a drop does not tell me why the developer made it.
- 1 · What changed?I found apps with an observed change to their title or full description.
- 2 · Who could I compare them with?I matched them with similar apps in the same chart and market that had no observed listing change.
- 3 · What happened before?I compared their chart movement before the listing change was first seen.
MY THEORY VS THE RESULT
The result surprised me.
My theory
Apps that changed their listing would have fallen further in the charts first.
The result
I did not find that pattern. In this sample, the comparison apps actually had a slightly larger average drop.
chart position → listing edit
These are study-specific visibility scores, not a count of chart positions in every case.
See the original result chart
The bars show the averages from this study, not a prediction for every app. A bigger bar means more visibility was lost.
What do these points mean? I used a simple chart visibility score. When an app stayed inside the top 100, a drop of one chart position counted as one point lost. If it left the chart, I gave it zero visibility; I could not see its exact position below the top 100.
Can I be certain? No. The difference I measured was small and uncertain. The data also allow for the possibility that there was no real difference between the groups. I cannot use this result to say the two groups were exactly the same.
Show me the statistical detail
The estimated difference was −0.67 points, comparing edited apps with the comparison apps. The reported 95% interval runs from −3.33 to +1.96 points and includes zero. This range reflects uncertainty in the selected sample; it is not a guarantee about all apps.
REAL APPS IN MY SAMPLE
Which apps did I look at?
Here are three real examples from the matched sample. These are observations from the archive, not claims about the developers’ intentions or evidence that a listing change caused a chart movement.
INDIA · APP STORE
Uber
I found an observed change to the app name. Its chart visibility fell by 14 points in the period I measured before that change.
BRAZIL · GOOGLE PLAY
Duolingo
I found an observed title change. Its chart visibility rose by 5 points in the period I measured before the change.
INDONESIA · GOOGLE PLAY
ShopeePay
I found an observed description change. Its chart visibility fell by 3 points in the period I measured before that change.
These examples show different patterns. They do not prove what drove any change. My conclusion comes from the full matched sample, not from these three apps alone. They are not presented as my clients.
HOW I DID IT
What did I compare?
255 observed edits
I studied 255 app and market observations from 162 distinct app identities. One app could appear in more than one market.
720 comparison apps
I selected similar apps from the same market, chart and date. Some comparison apps were used more than once.
Mostly free apps
236 observations were from free charts and 19 from paid charts. The findings mainly describe the free charts.
- FirstI used earlier chart movement to find comparable apps.
- NextI compared their chart movement over five days before the listing change.
- ThenI noted when the new listing was first seen. I do not know exactly when it was published or why the team changed it.
MY ASO TAKEAWAY
Do not jump to a neat explanation.
My ASO tip: If an app falls in the charts and then changes its listing, check whether a release, promotion or other activity happened too. I would not assume the drop caused the edit.
My ASO strategy: Keep a simple record of your listing changes, releases and campaigns. Compare similar traffic and conversion periods, and run controlled store experiments where possible.
My ASO warning: I did not test whether listing edits improve search rankings, installs or revenue. This result does not mean that ASO changes do not work.
WHAT I COULD NOT PROVE
Here is where the evidence stops.
- Why teams made changes: I could not see their intentions, advertising or plans.
- Whether the edits helped: I did not measure the effect of an edit on downloads or conversion.
- What happens to every app: I studied selected apps in charts over a short period.
- Whether every change was ASO: Some edits involved promotions, legal information or product updates.
- Whether titles behave differently: The group with title changes was too small to give a precise answer.
In 177 of the 255 observations, a version or update timestamp changed too. That gives me another reason to be careful about assuming why the listing changed.
SOURCES & METHODS
Want to check my work?
I used AppOrbit’s archived chart and listing records. I reran the supplied calculation checks, which reproduced 255 matched observations and the estimated difference. That checks the arithmetic; it does not independently confirm the original archive.
Other researchers explored the broader idea of updates following declining performance before me, including Comino, Manenti and Mariuzzo. I am not claiming that idea as a new discovery.
I have kept the full evidence packages locally while their redistribution rights are reviewed.
Read the original report and technical details
Do listing edits follow chart declines?
A matched observational study of public App Store and Google Play charts
Research date: 26 October 2026. Status: completed exploratory analysis, not peer reviewed. Verdict: the acquired sample does not support the proposed general relationship. It does not prove that no developer ever edits in response to a decline.
Abstract
We examined whether title or full-description edits were preceded by unusually poor chart performance. A public archive contains 300,480 chart entries and 244,883 metadata observations over 38 UTC days, 19 September to 26 October 2026, across 10 markets. After normalization, timing checks, complete-chart requirements and matching, the primary analysis contains 255 app-market edit observations across 162 distinct store-app IDs, compared with 720 distinct control store-app IDs. Each treated app receives equal overall weight across its eligible market observations.
Edited apps lost 0.35 visibility points during the guarded pre-edit window; controls lost 1.02. The excess loss was -0.67 points, with a 95% app-bootstrap interval of [-3.33, +1.96]. Positive excess loss would support the hypothesis; the point estimate is negative and its interval spans zero. All nine prespecified sensitivity intervals also span zero. Title edits alone are much less precisely estimated. A direct literature precedent also establishes that the broader idea of updates reacting to declining performance is not new.
1. Question and scope
The question was: do apps with observed listing edits show a greater loss of chart visibility before the edit than comparable apps without observed listing edits?
The theory concerns temporal ordering. A listing may be edited in response to a performance problem, making a naive before-and-after story misleading. This dataset can test a narrow descriptive implication. It cannot reveal developer intentions, measure native keyword-search positions, or estimate the causal effect of editing on downloads.
The analysis protocol was written before computing matched outcomes, after a prior feasibility audit. This is an exploratory protocol, not an externally registered study. Its SHA-256 is 406531e404ecf9b9fe9bade548b5adfe78c0f6215ccc880fb5cb350c0893e811. The full protocol and code are supplied.
2. Data and sample construction
The source is AppOrbit, pinned to the exact data-branch commit shown in the link. Its immutable chart snapshots and metadata events are separate records. The archive contains 3,143 snapshots, including 2,446 marked valid and 697 partial. Partial, failed and quarantined charts were excluded from estimation. Only valid free or paid charts with exactly 100 entries and an expected depth of 100 were eligible. Top-grossing charts were excluded.
The initial feasibility counts of 41 title-changing and 200 description-changing apps were not the study sample. Those counts required continuous chart presence around edits. This study instead imposes stricter timing and control requirements, permits chart exits, and does not require post-edit survival.
| Selection stage | Market-level edit observations |
| Nonempty normalized title/description edit events | 1,480 |
| Excluded: no complete preperiod or no baseline chart presence | 643 |
| Excluded: uncertain edit timing | 383 |
| Excluded: another observed edit in preceding 10 days | 95 |
| Excluded: fewer than two eligible controls | 55 |
| Excluded: another event already retained for the same app-market | 49 |
| Matched observations retained | 255 |
These exclusion counts are mutually exclusive in the code's processing order; changing that order could change the reason assigned to an excluded observation. They sum to the initial event count.
The primary matched observations include 236 free-chart observations and only 19 paid-chart observations. This is predominantly evidence about free charts. They run from 29 September to 25 October 2026. They cover BR, CN, DE, GB, ID, IN, JP, KR, US and VN. The sample includes 100 Apple observations and 155 Google Play observations, representing 71 and 91 distinct store-app IDs respectively. A cross-platform product is not automatically merged into a single app.
There are 45 title-only observations, 192 description-only observations and 18 that change both. The title-inclusive subgroup contains 35 distinct apps; the description-inclusive subgroup contains 145. These subgroups overlap and should not be added.
3. What counts as an edit
A title or full description must be nonempty before and after, and must differ after Unicode NFKC normalization and whitespace collapsing. The raw audit found 307 title transitions and 1,485 description transitions. We excluded 152 description transitions involving empty values or no remaining difference after normalization. Joint title-description changes count as one event.
A seeded qualitative spot-check of 20 events found promotions, features, legal disclosures, regional names, contact details and language changes. This was a single-reviewer spot-check, not validated semantic classification. We therefore call the exposure an observed listing edit. We do not assume that every edit was an ASO intervention.
4. Timing and outcome
Every metadata timestamp was converted from UTC into the source's recorded market timezone. US observations use America/New_York, not a guessed timezone. For each market and chart, the latest valid daily snapshot was retained.
Day 0 is the local date on which the new text was first observed. The exact publication time lies between the last old-text observation and first new-text observation. We require that the last confirmed old listing was observed on day -1 or day 0 and that the elapsed gap is at most 48 hours. The main outcome stops on day -2, before that last-old confirmation.
We compare day -7 with day -2: five elapsed days in a guarded pre-edit window, not a complete seven-day causal window. Earlier movement from day -10 to day -7 is used for matching. Matching on the same decline we are trying to test would remove the pattern by design, so the earlier and outcome windows are separate.
Visibility is defined as 101 minus chart rank while the app is in the top 100, and zero when absent from a complete top-100 chart. A positive loss is visibility on day -7 minus visibility on day -2. One visibility point equals one chart position while both observations are inside the chart. For exits, the measure is bounded and does not assign a true rank of 101 or claim to know how far below the cutoff an app fell.
Ten retained edited observations were outside the chart at day -2. We did not silently discard them. Re-entry and absence remain defined only when the chart itself was successfully observed.
5. Matching and uncertainty
Controls come from the same store, market, chart scope, free/paid chart and event date. They must be present on day -7, within 10 positions of the edited app at baseline, and within 10 visibility points of its earlier movement. We exclude the same app and the same known developer. Up to five nearest eligible controls are selected deterministically, with at least two required.
Controls have no observed normalized title or description edit from day -10 through day +1. Metadata observations must cover both ends, with no more than 72 hours between enclosing observations. This is conservative because metadata events are changes rather than a complete daily crawl log: some truly unchanged apps may fail that observation-density rule.
The primary analysis uses 1,165 control assignments drawn from 720 distinct control store-app IDs. The most frequently reused control appears 11 times. For overlapping app/game charts, the preferred eligible broad apps chart is selected before matching; otherwise the games chart is used. At most one chart and the first matched event are retained for each treated app-market.
We first average each edited app's market-level results, then average across distinct store-app IDs. This prevents one app observed in many markets from dominating. Uncertainty uses 10,000 bootstrap resamples of these app-level means, with fixed seed 20261026. Publisher-cluster bootstrapping is also reported. These intervals describe uncertainty within the selected observational sample. They do not make the archive a random sample of the app ecosystem, and do not fully account for all common market shocks or control reuse.
Baseline balance is close in aggregate: mean starting rank is 42.55 for edited apps and 42.16 for controls. Mean earlier visibility loss is -0.02 versus 0.06. The mean absolute market-level gaps are 1.78 positions at baseline and 2.00 points for the earlier trend. Matching does not balance unobserved advertising, publisher plans or demand shocks, and broad chart matching does not guarantee identical app genres.
6. Main results
| Measure | Edited apps | Matched controls |
| Mean pre-edit visibility loss | +0.35 | +1.02 |
| App-weighted frequency of a loss of at least 5 points | 29.87% | 31.06% |
The edited-minus-control difference is -0.67 points, with 95% interval [-3.33, +1.96]. The publisher-cluster interval is [-3.27, +1.84]. Neither interval excludes zero. The five-point-decline frequency difference is -1.19 percentage points, with interval [-7.83, +5.45] percentage points. These frequencies average market observations within each app and are not simple percentages of unique apps experiencing any decline.
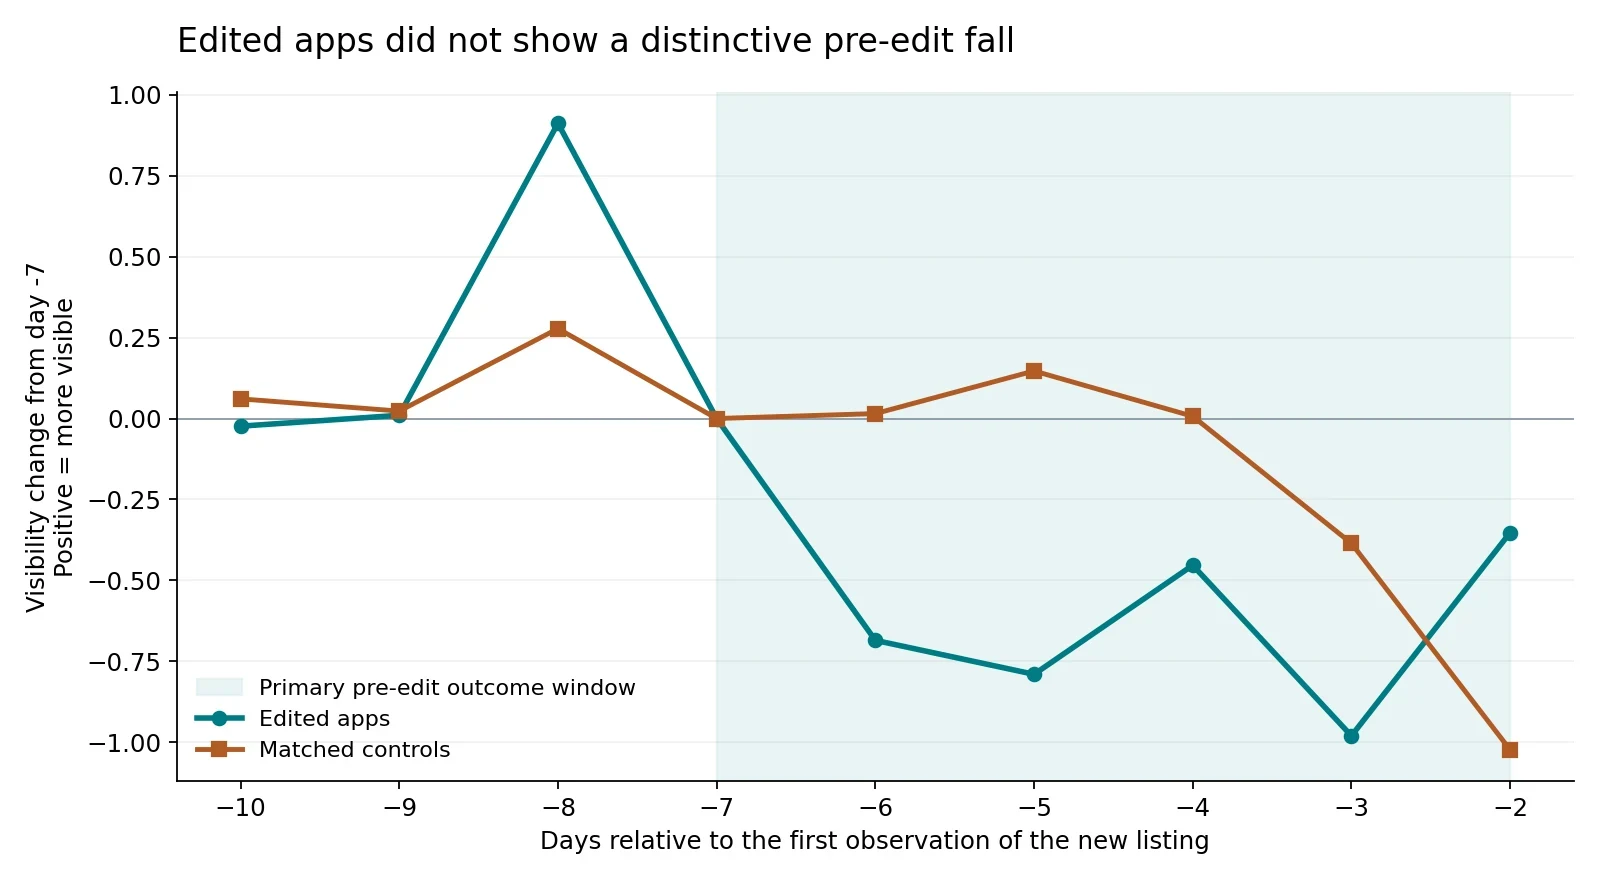
The primary point estimate runs opposite to the proposed direction. However, the result is not proof of equivalence or proof that reactive editing never occurs. Smaller positive average relationships remain compatible with the interval, and the title subgroup is particularly imprecise.
7. Store and edit-type comparisons
| Subgroup | Distinct apps | Market observations | Excess loss | 95% app-bootstrap interval |
| Apple | 71 | 100 | -1.49 | [-4.94, +1.99] |
| Google Play | 91 | 155 | -0.03 | [-3.92, +3.68] |
| Any title change | 35 | 63 | +1.74 | [-4.54, +8.47] |
| Any description change | 145 | 210 | -0.80 | [-3.49, +1.78] |
| Title-only events | 18 | 45 | +0.55 | [-9.47, +11.47] |
| Description-only events | 129 | 192 | -1.31 | [-4.19, +1.50] |
These are exploratory subgroup comparisons, not independently confirmed discoveries. Title changes have a positive point estimate but a wide interval spanning substantial negative and positive differences. It would be selective reporting to present the title estimate as proof while ignoring its uncertainty and the primary result. The store populations also differ: Apple’s broad apps feed can include games, whereas Google’s apps scope excludes them; some observations use separate game charts.
8. Sensitivity analyses
All nine prespecified alternative analyses have intervals spanning zero. Because matching and eligibility are rerun, sample sizes and app composition differ across specifications. They are not nine independent replications.
| Specification | Distinct apps | Excess loss | 95% app-bootstrap interval |
| Primary matched analysis | 162 | -0.67 | [-3.33, +1.96] |
| Tighter matching (5 points) | 114 | +0.68 | [-1.60, +3.12] |
| Wider matching (15 points) | 181 | -0.06 | [-2.58, +2.46] |
| No earlier-trend matching | 189 | +1.66 | [-0.98, +4.23] |
| Edit interval at most 24 hours | 109 | +0.38 | [-2.37, +3.25] |
| No observed release cochange | 51 | -1.65 | [-7.32, +3.71] |
| Starting ranks 11 to 90 | 131 | -0.03 | [-3.00, +2.95] |
| At least 3 controls | 149 | -0.49 | [-3.28, +2.23] |
| Also match rating volume | 139 | -1.50 | [-4.32, +1.29] |
| Exclude preperiod chart exits | 149 | -1.67 | [-3.86, +0.42] |
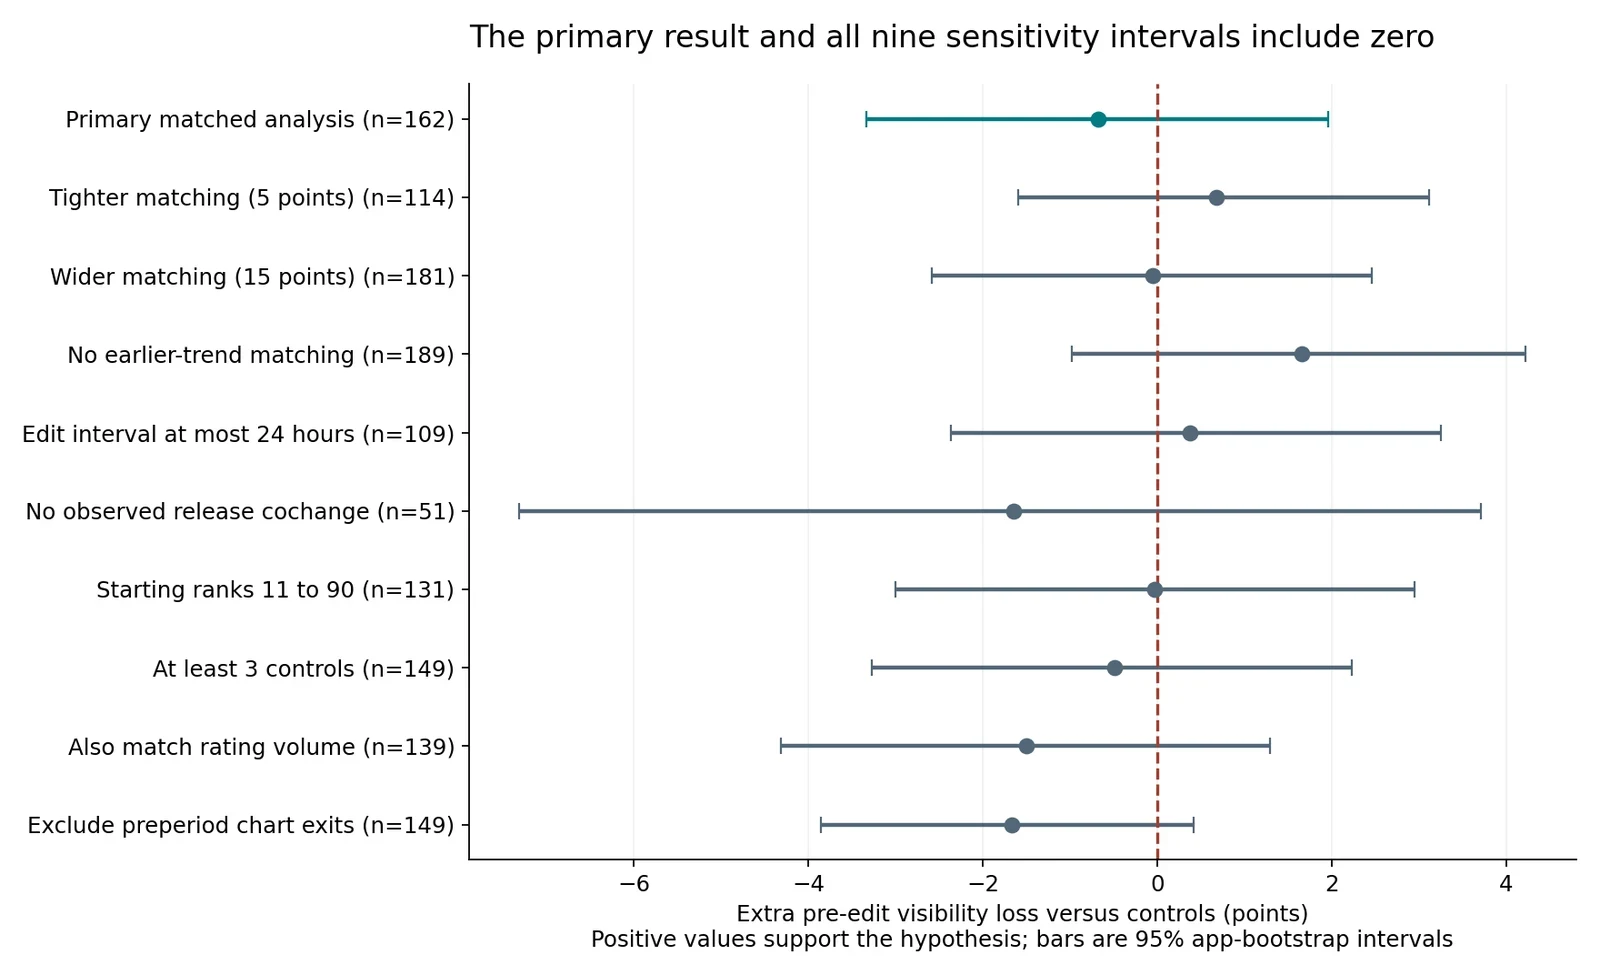
An additional descriptive check excluding observations with a simultaneous price change gives an excess loss of -0.18, interval [-2.62, +2.29]. Post hoc leave-one-app-out estimates range from -1.07 to -0.18; leave-one-country-out values are supplied in additional_diagnostics.json. These checks do not replace the primary specification.
9. Software releases are a major competing explanation
177 of 255 matched observations (69.4%) also change the version string or reported update timestamp between the old and new metadata observations. This includes all 100 Apple observations, and 77 of 155 Google Play observations. Co-occurrence is observational: it does not prove simultaneous publication to the second or identify which change influenced behaviour.
The sensitivity analysis excluding release cochanges retains 51 distinct apps and still provides no evidence of excess pre-edit decline. It is a re-matched sample, not simply a subtraction from the primary sample. It contains Google Play observations only, so it cannot establish how standalone Apple listing edits behave.
Apple's official app-information documentation explains that changing a name depends on a new version or an editable app status. This makes release cochanges a substantive design issue, rather than a nuisance we can ignore.
10. What happened after the edits?
The supplied secondary trajectory file tracks day -10 through day +7 for 156 matched observations across 102 apps with complete chart coverage throughout. Absence from a complete chart remains zero visibility, so post-edit survival is not required. This is a smaller, selected chart-coverage subset.
We do not turn its post-edit movements into an ASO lift estimate. Later listing edits, releases and advertising may intervene; controls were screened for listing stability only through day +1. The study's supported result concerns the guarded pre-edit comparison. A before-and-after recovery would not by itself establish that the edit caused it.
11. Prior research and originality
The closest precedent is Comino, Manenti and Mariuzzo, Updates Management in Mobile Applications: iTunes vs Google Play, working-paper version dated 8 May 2018. It already theorizes that software updates can respond to worsening performance and reports related evidence for iTunes. Consequently, the broad reactive-update idea cannot be presented as a new theory. Our narrower contribution is an exploratory, reproducible check of observed listing-text edits using chart visibility in a different period.
Potharaju, Rahman and Carbunar's A Longitudinal Study of Google Play provides earlier longitudinal app-market and chart-dynamics context. A 2026 practitioner study by ConsultMyApp also documents listing wording changes and cautions against causal attribution. Neither supplies data to our estimates. The source review is targeted prior-art checking, not an exhaustive systematic literature review, and does not establish novelty of the narrower question.
12. Limits and conclusions
- This is a short, selected panel of top-chart apps. It cannot represent all apps, long-term behaviour, annual seasonality or search-keyword ranking.
- Developer motives, ad spending, search impressions, conversion, downloads and revenue are not observed. No listing edit was randomized.
- Edit publication is interval censored. The guard improves temporal ordering but cannot identify the decision date or a delayed reaction to an earlier decline.
- We test a five-day guarded pre-edit change after matching on an earlier three-day trend. We cannot rule out reactions over longer or much shorter windows.
- Unobserved edits between crawls, edits outside chart coverage, omitted subtitles and short descriptions, localized variants, and unchanged metadata omitted from the event stream can misclassify exposure or controls.
- Control selection and observation-density requirements select a particular comparison population. Rank matching does not remove all genre, business-model or popularity differences.
- Reused controls, shared developers and common country/day shocks can create dependence. App and publisher intervals are useful diagnostics, not complete design-based inference.
- Full-text changes are not necessarily optimization changes. Promotions, legal notices and product announcements were observed in the spot-check.
- The title subgroup is small and imprecise. A null pooled estimate cannot rule out meaningful relationships for particular kinds of edits or apps.
- Historical source snapshots were structurally validated; they were not independently re-observed in the stores on their original dates. Findings are conditional on this public archive's accuracy.
Conclusion: this sample does not support the claim that observed listing edits generally follow unusually poor recent chart performance. The result should be published, if at all, as a bounded null finding and a methods contribution, not as proof of reactive ASO, proof that editing is ineffective, or a newly discovered general theory.
13. Reproducibility and reuse
The package contains protocol.json, extraction and analysis code, exact matched events and controls, complete results and diagnostics, source provenance, this report and figures, and the normalized inputs needed to rerun the matched analysis. The raw 292 MB source archive is referenced by pinned commit and SHA-256 rather than duplicated. The raw-source archive SHA-256 is d2ce079fd8af2e7a4d652c5446534798c342acc1426244dc5e5554df91232641.
Run python3 ASO_Study_01/analyse.py from the extracted bundle's parent directory with NumPy installed. Run verify.py for the independent arithmetic checks. Matplotlib is required to rebuild figures/report. Rebuilding listing_events.jsonl.gz from the original archive uses extract_events.py. The extraction script expects the original raw archive in the adjacent aso_data_round2 directory. Environment versions and input hashes are supplied.
Database attribution: AppOrbit contributors, https://github.com/ivershuo/apporbit. AppOrbit-owned database rights are licensed under ODbL 1.0; the notice does not relicense third-party app content. The private replication inputs preserve source context and are not a blanket grant to republish app descriptions. No external publication or outreach has been performed.
Keep exploring
All ASO experiments · Track listing changes · Choose useful ASO metrics · Test an App Store product page